Roy Mwavita
Research Data Analyst • Monitoring & Evaluation Specialist
📈 Scalable M&E System for NGO Impact
An end-to-end digital Monitoring & Evaluation system built using KoBoToolbox, R, and Shiny to automate data collection, scoring, reporting, and real-time program monitoring for NGOs and CBOs.
📊 Labor Market Uncertainty & Employment Retention
An applied labor economics and behavioral data science case study modeling the psychological and structural drivers behind "Job Hugging."
🛠️ validationcheck Package
An R package for automated data validation, quality assurance, and reporting in public health and research workflows.
📌 Strengthening Community Health Promoter Systems through Geospatial Mapping
Geospatial analysis of Community Health Promoter coverage and household distribution using KoboToolbox, R, and Leaflet.
📈 Scalable M&E System for NGO Impact
Project Type: Digital Monitoring & Evaluation System
Status: 🟢 Live Demonstration Project
Tools & Technologies: KoBoToolbox, KoBo API, R, robotoolbox, tidyverse, dplyr, Shiny, shinyapps.io, GitHub
🧠 Problem Statement
Small NGOs and community-based organizations often rely on disconnected spreadsheets, manual reporting processes, and limited technical infrastructure. These challenges result in delayed reporting, duplicate records, poor data quality, and limited visibility into program performance.
🎯 Solution
I designed and deployed an automated Monitoring & Evaluation ecosystem that connects data collection, storage, processing, analysis, and reporting into a single reproducible workflow.
The system eliminates manual data downloads by pulling submissions directly from KoBoToolbox through its API, processing data in R, and displaying real-time insights through an interactive Shiny dashboard.
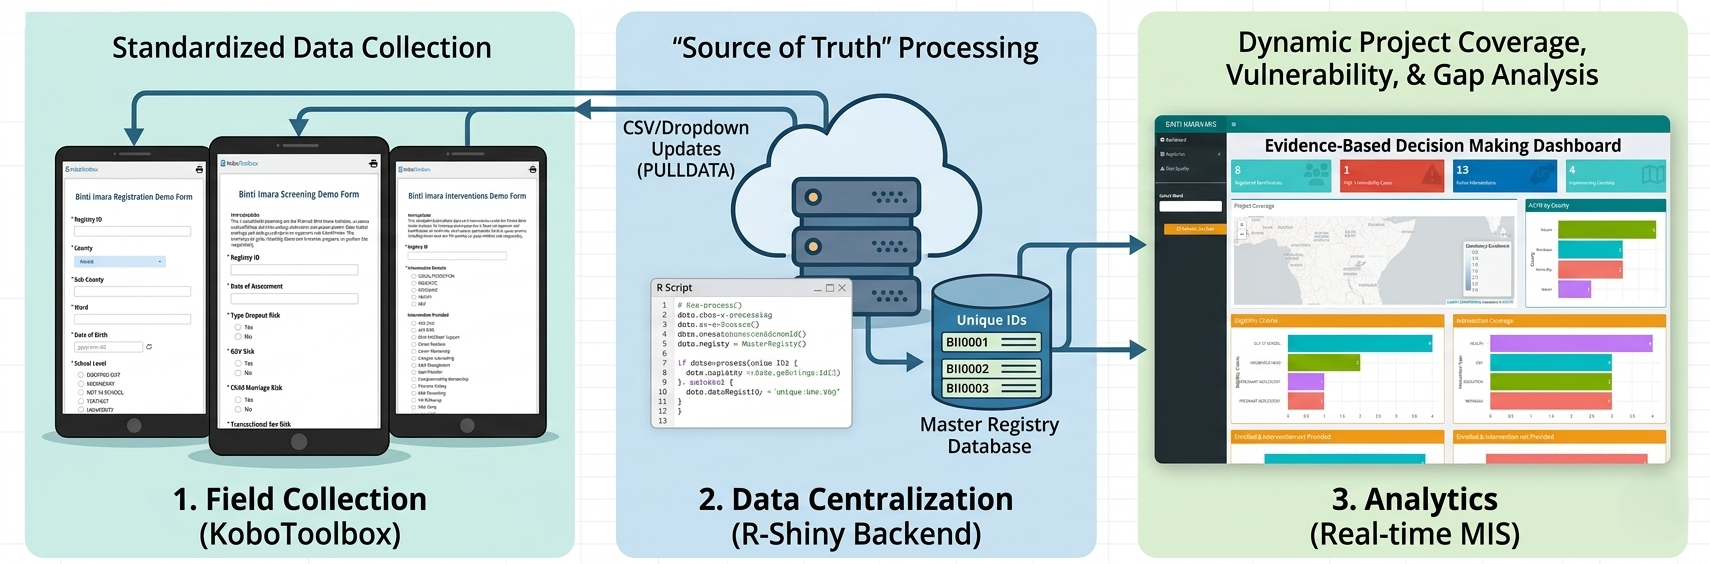
⚙️ System Architecture
- 📱 KoBoToolbox – Offline mobile data collection
- ☁️ KoBo API – Automated data retrieval
- 🧹 R + tidyverse – Data cleaning and transformation
- 📊 Scoring Algorithms – Vulnerability assessment
- 📈 Shiny Dashboard – Real-time monitoring
- 🚀 shinyapps.io – Cloud deployment
🗂️ Data Collection System
The project uses three integrated KoBoToolbox forms:
- Registry Form – Beneficiary enrollment
- Screening Form – Vulnerability assessment
- Intervention Tracking Form – Service delivery monitoring
Data entered through the forms is automatically synchronized and processed without requiring manual exports.
📊 Dashboard Outputs
- Active beneficiaries
- Vulnerability scoring
- Intervention coverage
- High-risk case identification
- Real-time monitoring indicators
- Automated reporting summaries
🚀 Impact
- Reduced reporting workload through automation
- Improved data quality using built-in validation
- Enabled real-time program monitoring
- Provided a low-cost M&E solution for NGOs and CBOs
- Demonstrated a scalable digital data ecosystem using open-source tools
🔗 Live Resources
📊 Labor Market Uncertainty and Employment Retention: "Job Hugging"
Project Type: Applied Labor Economics & Behavioral Data Science Case Study
Status: 🟡 Data Collection & Modeling in Progress | 🟢 Infrastructure Complete
Tools & Technologies: R (tidyverse, psych, stats, ggplot2), R Shiny, KoboToolbox API, World Bank & ILOSTAT APIs
🗺️ Production Artifacts & Live System Architecture
This pipeline is engineered as an automated data product. The data collection layout and operational tracking system are deployed up front to handle streaming field entries cleanly without manual intervention.
📋 Primary Data Collection Tool
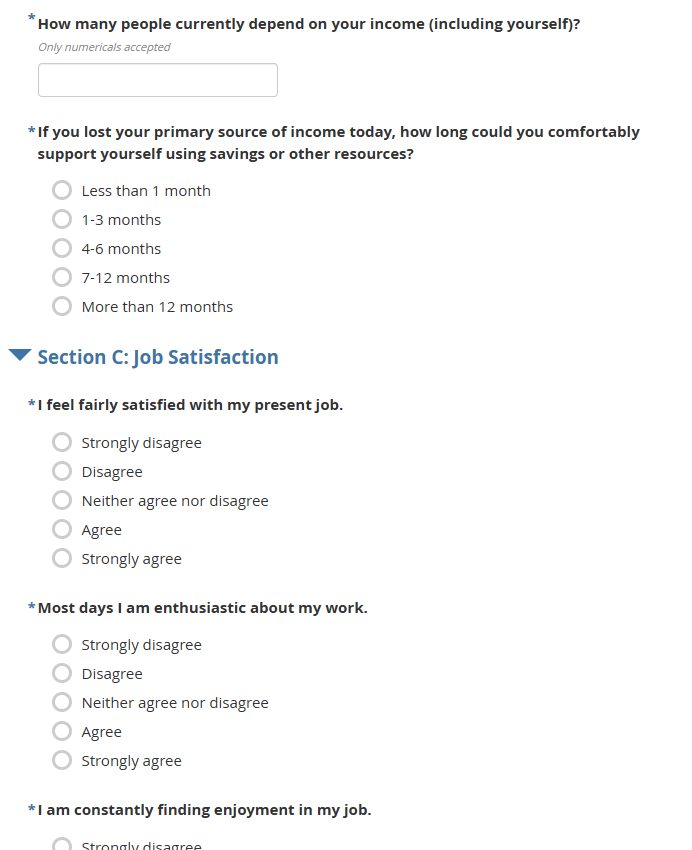
Mobile-responsive tool engineered via KoboToolbox. Deploys tailored constraints and logic forks across sector paths (Tech, Retail, and NGOs) to secure structural integrity before collection. Link to survey form
🖥️ Live Survey Tracking Dashboard
Real-time monitoring system
styled with the fresh theme engine. Features customized ggplot2 visual frameworks and maps metrics dynamically via direct API callbacks.
Link to dashboard
🧠 Problem Statement
Modern labor markets are experiencing a structural paradox: while widespread workplace dissatisfaction remains documented, voluntary job mobility is declining across multiple core industries. This study investigates this emerging behavioral pattern—empirically operationalized as "Job Hugging"—where workers choose to remain in their current roles despite actively considering alternative employment, driven by compounding macroeconomic anxiety and asymmetric household financial constraints.
🧪 Methodology & Measurement Instruments
This quantitative cross-sectional behavioral study integrates validated primary psychometric measurement sub-scales with structural secondary macroeconomic indicators:
- Job Satisfaction: Measured via the Brayfield-Rothe 5-item scale variables (
js1tojs5). - Job Insecurity: Tracked via the De Witte 4-item scale indicators (
ji1toji4). - Perceived Employability: Operationalized via the Rothwell & Arnold scale variables (
pe1tope4). - Financial Buffering: Modeled using numerical dependent ratios (
income_dependents) and categorical timelines (emergency_buffer).
⚙️ Data Engineering & Econometric Framework
- Pipeline Automation: Configured programmatic API calls via
robotoolboxto completely eliminate raw CSV exports, processing row binding algorithms live in workspace memory. - Psychometric Validation: Integrated scale verification via the
psychlibrary to compute Cronbach's alpha coefficients, enforcing a strict internal reliability threshold of alpha ≥ 0.70. - Model Specification: Implemented a Binary Logistic Regression Model estimating the log-odds probability of voluntary job mobility over a 12-month window against composite psychological scores and structural cross-country unemployment records.
🚀 Strategic Expected Impact
- Empirically bridges macro-level labor marketplace constraints with micro-level worker sentiment realities.
- Enables human resource professionals and policy researchers to cleanly differentiate between positive retention and security-driven talent lock-in.
- Deploys an automated, production-ready pipeline architecture highlighting an end-to-end data product lifecycle.
🛠️ validationcheck: Function-Based Data Validation Framework
Project Type: R Package for Data Quality Validation
Status: In Development
Tools: R, tidyverse, dplyr, testthat, GitHub
🧠 Problem Statement
Data validation in real-world monitoring and evaluation workflows is often fragmented, with analysts writing repetitive scripts for missing values, duplicates, invalid ranges, and logical inconsistencies. Existing tools such as pointblank provide powerful validation pipelines, but they require structured setup that can slow down rapid analysis in field-based environments.
🎯 Solution
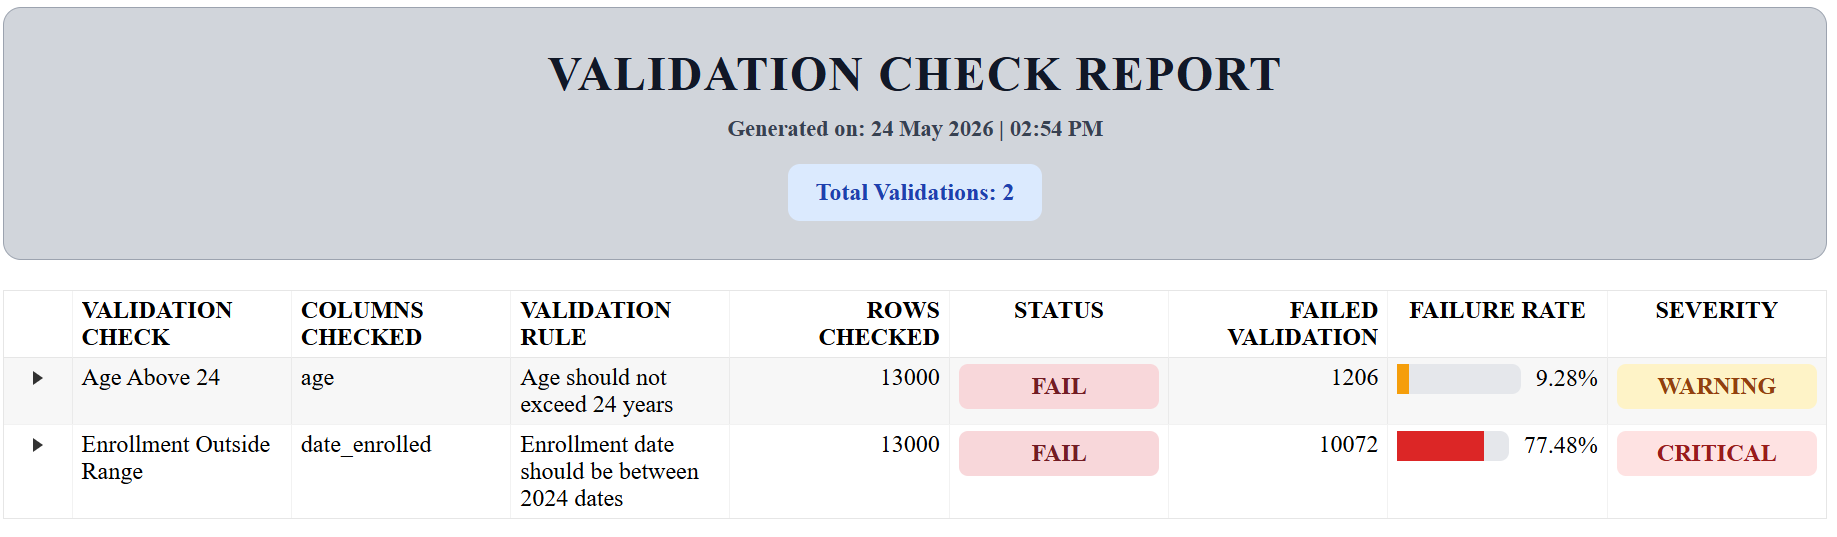
validationcheck introduces a function-based validation system that allows users to define and execute validation rules in a simple, readable pipeline while tracking summaries, failure rates, and severity classifications (GOOD, WARNING, CRITICAL).
⚙️ Core Function: add_validation()
add_validation(
  agent,
  label,
  columns,
  rule,
  preconditions = NULL,
  check
)
📊 System Outputs
Severity Rules:
GOOD: 0% – 2% failure | WARNING: 2% – 20% failure | CRITICAL: > 20% failure
📌 Strengthening Community Health Promoter Systems through Geospatial Mapping
Organization: Council of Imams and Preachers of Kenya (CIPK) Taita Taveta Branch – USAID TUJITEGEMEE Project
Type: Community Health Systems Strengthening & Geospatial Analysis
Tools: R, Shiny, Leaflet, KoboToolbox, dplyr, Excel
🧠 Problem Statement
During an OVC household validation exercise, program teams identified challenges related to the geographical distribution of households supported by Community Health Promoters (CHPs). Some CHPs were supporting households located far from their areas of operation, while others experienced overlapping household assignments. These inefficiencies affected case management, follow-up visits, and service delivery.
🧪 Methodology
- Designed and deployed a KoboToolbox survey to collect CHP geolocation data.
- Integrated household geolocation records collected during beneficiary validation exercises.
- Cleaned and processed data using R.
- Conducted geospatial analysis using Leaflet to map CHP and household locations.
- Identified overlapping coverage areas and household assignment gaps.
- Developed an interactive map to support evidence-based decision making.
🗺️ Project Workflow
Data Collection
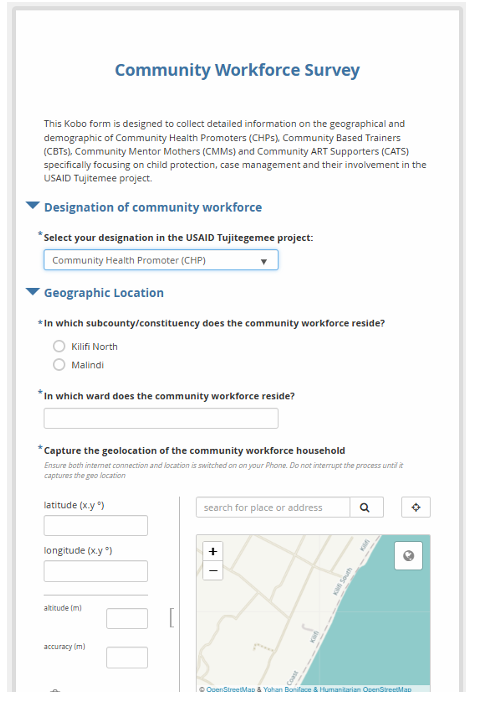
Geolocation survey developed in KoboToolbox and used to collect Community Health Promoter location data.
Analytical Output
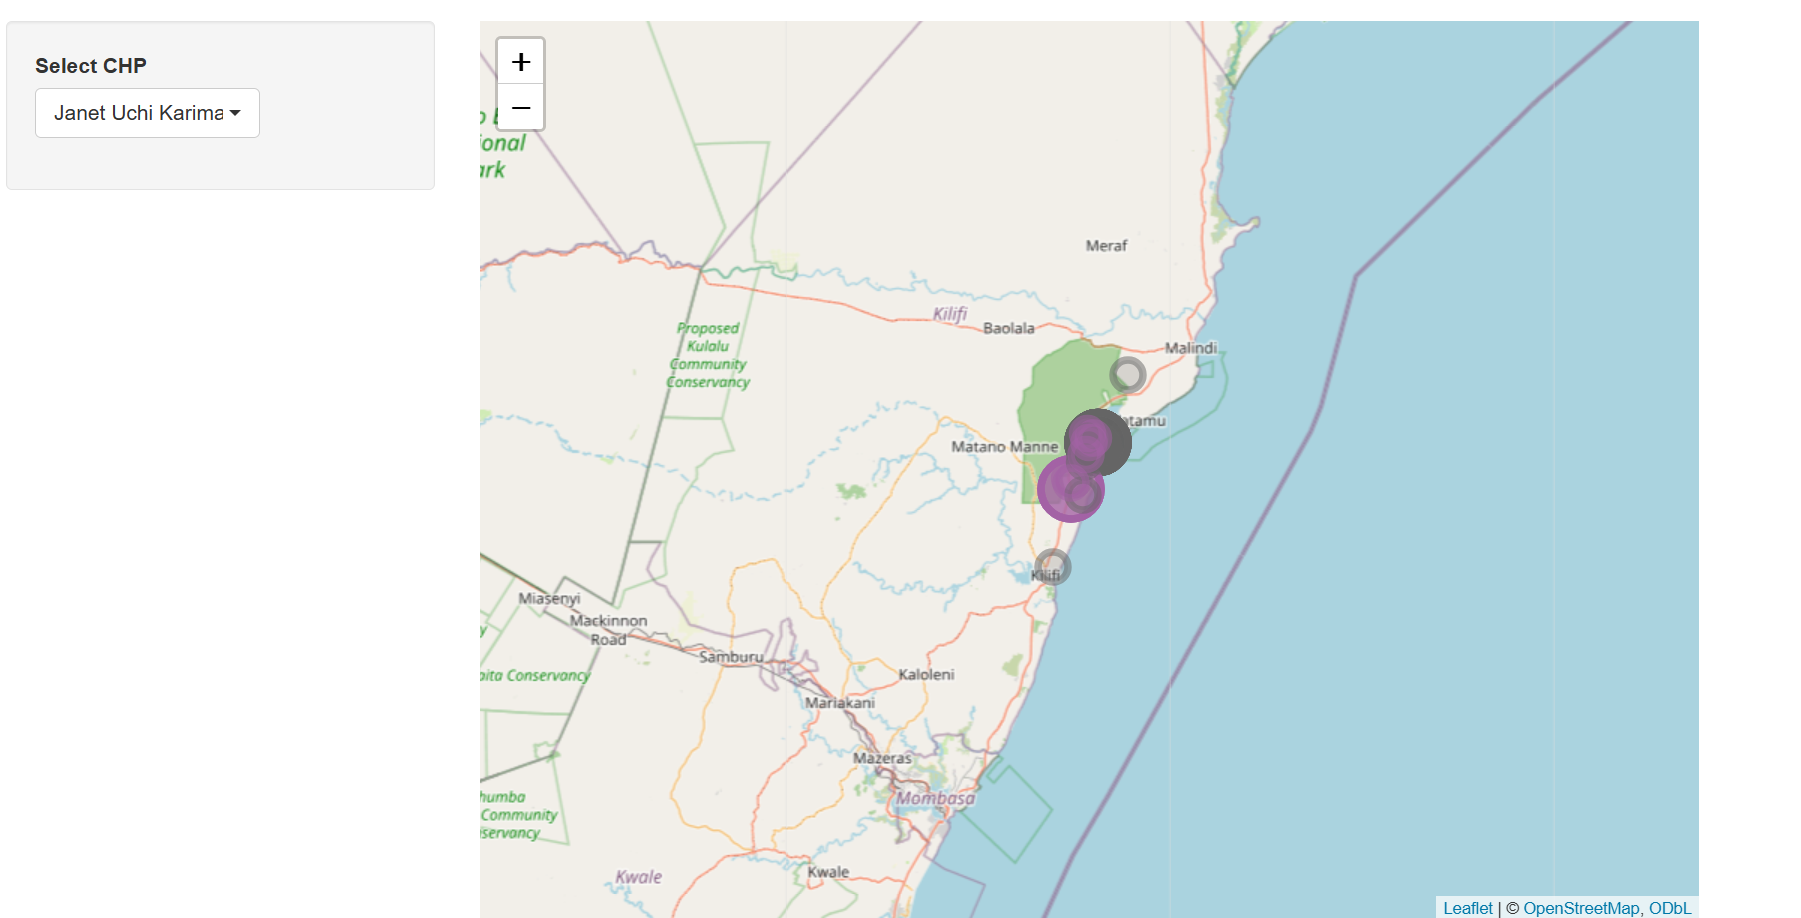
Interactive map showing CHP and household distribution used to identify overlaps and service coverage gaps.
📊 Key Findings
- Household assignments were not always aligned with the nearest CHP.
- Several households overlapped across CHP coverage areas.
- Significant variation existed in household distribution among CHPs.
- Distance between CHPs and households affected service delivery efficiency.
🚀 Outcome
- Improved visibility of CHP household coverage areas.
- Supported evidence-based household realignment decisions.
- Strengthened planning and resource allocation for OVC case management.
- Demonstrated the value of geospatial analytics for community health programming.